How to Calculate and Improve Customer Support ROI

Customer support ROI measures the financial return your support operation generates relative to what it costs, calculated as: (Financial gains from support − Cost of support) ÷ Cost of support × 100. Two levers move that number more than anything else: reducing per-contact cost through efficiency and automation, and increasing revenue retained or expanded through better customer experiences.
The formula you can copy into a spreadsheet right now:
ROI (%) = (Gains − Costs) ÷ Costs × 100
Three things to measure first, before anything else:
- Cost per contact (total support spend ÷ total contacts handled)
- Retention-driven revenue (estimated revenue preserved by reducing churn attributable to service failures)
- Upsell and expansion rate from support interactions (tickets that convert to upgrades or add-ons)
Pro Tip: If you can only pull one number this week, pull cost per contact. It is the single most actionable input in any ROI model and the fastest to improve.
According to HubSpot’s research, a 5% improvement in customer retention can translate to a 25–95% increase in profits. That range is wide, but even the low end of it dwarfs most support cost-reduction efforts, which is exactly why retention belongs in your ROI model from day one.
Key Takeaways
Customer support ROI is most reliably improved by combining per-contact cost reduction with retention-driven revenue attribution, measured over a 90-day pilot before scaling.
| Point | Details |
|---|---|
| Core formula | ROI (%) = (Gains − Costs) ÷ Costs × 100; gains include retention revenue, upsells, and cost savings. |
| Retention impact | A 5% retention improvement can increase profits by 25–95%, making retention the highest-leverage gain category. |
| AI deflection range | Well-configured AI pilots typically deflect 10–40% of simple contacts, with payback in 3–9 months. |
| Attribution discipline | Use cohort analysis to attribute retention gains to support; aggregate churn rate changes are not sufficient. |
| Deskhero pilot path | Deskhero connects to existing mailboxes in minutes, providing baseline ticket analytics for a 30-day ROI pilot. |
Table of Contents
- What Does Customer Support ROI Actually Mean for Your Business?
- How to Calculate Customer Support ROI: Formula and Worked Example
- Which Metrics Actually Drive Customer Support ROI?
- What Are the Benchmarks for AI and Automation ROI in Support?
- How to Build a Business Case and Forecast ROI Over Time
- Common Measurement Mistakes That Erode True ROI
- Practical Actions That Improve Customer Support ROI
- A Value-Based Framework for Capturing ROI Beyond Operational Metrics
- How Indirect Benefits Fit Into Your ROI Calculation
- In-House vs. Outsourced Support: How Staffing Models Affect ROI
- How Technology Costs and Depreciation Affect Your ROI Model
- Case Studies: Before-and-After ROI Improvements in Support
- The Part of ROI Models That Always Surprises Leadership
- Deskhero Gives Your Support Team a Measurable ROI Starting Point
- Sources
- FAQ
What Does Customer Support ROI Actually Mean for Your Business?
Customer support ROI is not just a cost-center metric. It is a financial lens that connects support activity to three measurable business outcomes: cost savings, revenue preserved through retention, and revenue generated through upsells, referrals, and expansions.
The standard definition, per Balto’s ROI framework, treats financial gains as the sum of cost savings (labor, tools, overhead avoided), retention-driven revenue (customers who stayed because of good service), and upsell or cross-sell revenue generated during support interactions. Costs include agent salaries, software subscriptions, training, overhead allocation, and technology depreciation.
Why should leaders measure this at all? Three reasons:
- Budget justification. Finance teams respond to ROI percentages and payback periods, not CSAT scores. A documented ROI model turns a budget request into a business case.
- Prioritization. When you know which activities drive the most financial return, you stop spreading resources evenly and start concentrating them where they compound.
- Forecasting. A repeatable model lets you project the impact of a headcount change, a new tool, or a process improvement before you spend the money.
The components that feed into “financial gains” are broader than most teams initially model. HBR’s analysis on customer lifetime value shows that profit is heavily concentrated among a company’s highest-value customers, which means even modest retention improvements among that segment can produce outsized financial results. Beyond retention, the gains side of your model should include:
- Revenue preserved from at-risk customers who received proactive service
- Upsell and cross-sell revenue attributed to support interactions
- Referral revenue from customers who became advocates after a strong service experience
- Cost avoidance from deflecting contacts through self-service and automation
Treating support as a financial lever, rather than a cost to minimize, is the shift that makes ROI measurement worth the effort.
How to Calculate Customer Support ROI: Formula and Worked Example
The formula is straightforward. The work is in converting operational metrics into dollar values.
Step-by-step method
- Establish your baseline. Pull three months of data: total support spend (salaries, tools, overhead), total contacts handled, churn rate, average revenue per user (ARPU), and any upsell revenue attributed to support.
- Map metrics to dollar values. Convert each operational metric to a financial figure (see the table below for examples).
- Sum your gains and costs. Add all financial gains; add all costs including depreciation on technology.
- Apply the formula. ROI (%) = (Total Gains − Total Costs) ÷ Total Costs × 100.
- Interpret the result. A positive percentage means support generates more value than it consumes. A negative result means costs exceed measurable gains, which usually signals missing attribution rather than a truly unprofitable function.
Calculator-ready inputs
Worked example
At $120 ARPU and a 12-month horizon, that is $14,400 in retained annual revenue from one half-point churn reduction.
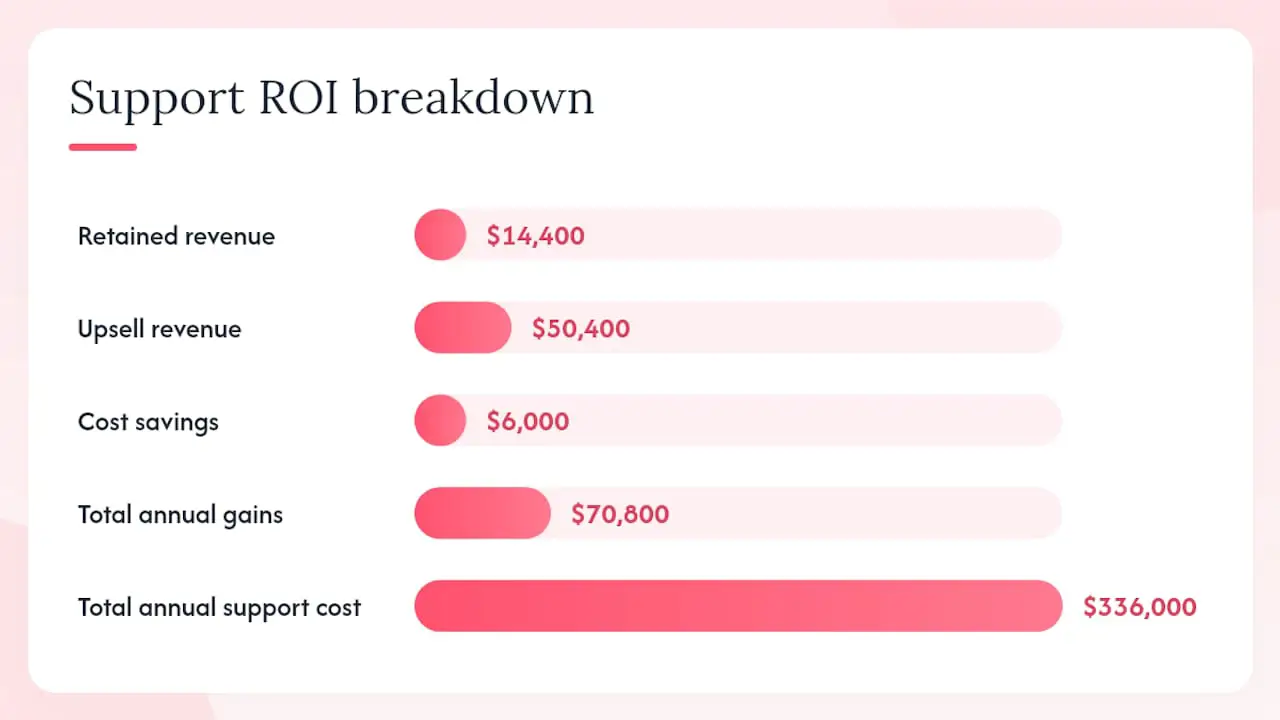
Add $4,200/month in upsell revenue tagged to support interactions ($50,400 annually) and $6,000 in annual cost savings from a first-contact resolution improvement that eliminates 500 repeat contacts per month at $1 each in labor.
Total annual gains: $14,400 + $50,400 + $6,000 = $70,800 Total annual support cost: $28,000 × 12 = $336,000
That negative result is not a failure of the support team. It reflects that most of the value support creates is not yet attributed. The model above captures only a slice of retention and upsell. A complete model would also include referral revenue, brand equity effects, and cost avoidance from deflection. The point of the worked example is to show the structure, not to suggest support is unprofitable.
Pro Tip: Pull your data sources from three places: payroll or HR for fully loaded agent costs, your CRM for churn and upsell figures, and your helpdesk for ticket volume and AHT. Finance teams trust models built from primary data over estimates.
Which Metrics Actually Drive Customer Support ROI?
Operational metrics only matter when you can convert them to dollars. Here is how the key categories connect to financial outcomes.
Cost-efficiency metrics
- Average handle time (AHT): Lower AHT means more contacts per agent hour. Each minute saved across 4,000 monthly tickets at $35/hour saves roughly $2,333/month. But AHT alone is a trap (more on that in the mistakes section).
- Cost per contact: Total support spend ÷ contacts handled. This is your efficiency baseline.
- Agent utilization: The percentage of paid hours spent on actual support work. Low utilization inflates cost per contact without any quality benefit.
Resolution quality metrics
- First-contact resolution (FCR): Every percentage point improvement in FCR eliminates repeat contacts. If FCR rises from 70% to 75% on 4,000 monthly tickets, you eliminate 200 repeat contacts. At $7 average cost per contact, that is $1,400/month saved.
- Quality assurance (QA) scores: Higher QA correlates with fewer escalations and lower churn from service failures.
Retention and revenue metrics
- Churn attributable to service: Segment your churned customers by exit reason. Service-attributed churn is the most direct input to retention-driven revenue gains.
- Upsell and expansion rate from support: Tag CRM opportunities that originated in a support interaction. This is the clearest path to showing support as a revenue generator.
CX leading indicators
- CSAT and NPS: These predict future retention and referral behavior. A 10-point NPS improvement has been correlated with measurable revenue growth in multiple industry studies, though the exact multiplier varies by sector.
- Customer Effort Score (CES): Lower effort predicts higher retention more reliably than CSAT in many B2B contexts.
Pro Tip: Set a 90-day attribution window for retention and upsell events linked to support interactions. Shorter windows miss the compounding effect; longer ones introduce too much noise from other business activities.
For teams working to increase customer retention, tying these metrics to specific support interactions is the fastest way to build a credible revenue case.
What Are the Benchmarks for AI and Automation ROI in Support?
A 2026 Gartner survey found that 91% of customer service leaders are under pressure to implement AI, making automation scenarios a near-mandatory component of any forward-looking ROI forecast.
Industry analyses on AI ROI in support suggest average returns in the range of $3–$4 per dollar spent for organizations that deploy AI effectively, with top performers reporting higher multiples. However, sample variability across vendor reports is significant, and those figures should be treated as directional rather than guaranteed. Apply them as a ceiling scenario in your model, not a baseline.
A few important caveats when applying these benchmarks:
- Deflection rates depend heavily on the quality of your knowledge base. An AI chat-bot trained on sparse or outdated content will deflect far fewer contacts than one trained on a well-maintained FAQ.
- Cost-per-resolution figures vary by industry, contact complexity, and whether you count only direct labor or fully loaded costs.
- Customer demographics affect channel adoption. Younger customer bases tend to adopt self-service faster, while enterprise B2B customers often prefer agent-handled interactions regardless of AI availability.
Gartner’s guidance on maximizing customer service value argues that the highest-ROI shift is not from reactive issue resolution to faster resolution, but from reactive resolution to proactive value delivery. That reframe changes what you measure: instead of tracking how quickly you close tickets, you track how often service interactions prevent churn or create expansion opportunities.
For teams modeling AI in customer service, the most defensible approach is to run a 60–90 day pilot on a defined contact category, measure deflection and cost-per-contact before and after, and use that data to build your projection rather than relying on vendor benchmarks alone.
How to Build a Business Case and Forecast ROI Over Time
A credible business case for a support investment has six components: objective, baseline, projected gains and costs, timeline, payback period, and a sensitivity analysis showing conservative, likely, and aggressive scenarios.
Building the forecast
- Define the objective. Be specific: “Reduce cost per contact by 20% and improve 90-day retention by 1 percentage point within 12 months.”
- Lock down the baseline. Pull three months of actuals for cost per contact, churn rate, ARPU, and upsell rate. Finance will scrutinize these numbers, so use primary data sources.
- Project gains and costs. Model each gain category separately (cost savings, retention revenue, upsell revenue). Avoid bundling them into a single “efficiency gain” line.
- Build three scenarios. Conservative assumes 50% of projected gains materialize. Likely assumes 75–80%. Aggressive assumes full realization. Show all three.
- Calculate payback period. Divide total investment cost by monthly net gain. A $60,000 tool investment that saves $8,000/month net has a 7.5-month payback.
- Add sensitivity analysis. Show what happens if churn attribution is off by 50%, or if deflection rates come in at the low end of benchmarks.
Cost savings from automation tend to appear within the first quarter. Retention and CLV gains build over two to four quarters as cohort data accumulates. Plan your timeline accordingly, and tell finance which gains are early versus lagging.
Pro Tip: Lock down two finance inputs before you present: the company’s discount rate (for NPV calculations) and the agreed-upon churn attribution methodology. Disagreements about attribution will derail a business case faster than any number in the model.
Customer feedback loops that feed back into product and service design can accelerate the retention gains in your model, often appearing in cohort data within two quarters.
Common Measurement Mistakes That Erode True ROI
Most ROI models understate support’s value. A few mistakes account for most of the distortion.
The AHT trap. Optimizing for lower average handle time without controlling for resolution quality produces faster contacts that generate more repeat contacts. Net cost goes up, not down. Always pair AHT with FCR and CSAT before drawing conclusions.
Poor retention attribution. Crediting all churn reduction to support when marketing, product, and pricing also changed during the same period inflates support’s apparent ROI. Use cohort analysis: compare retention rates for customers who had a support interaction versus those who did not, controlling for tenure and segment.
Ignoring allocation efficiency. ServiceXRG’s analysis identifies allocation as the most underexamined cost driver in support: deploying senior engineers to routine password resets, or routing strategic enterprise accounts to tier-1 agents, wastes expensive capacity and creates retention risk. Measuring who handles which customer tier reveals both cost waste and revenue risk simultaneously.
Double-counting savings. If your model counts both “labor hours saved by automation” and “reduced headcount cost,” you may be counting the same saving twice. Pick one representation per efficiency gain.
ROI input audit checklist
- Verify cost per contact uses fully loaded agent costs, not just base salary.
- Confirm churn attribution is based on cohort analysis, not aggregate churn rate changes.
- Check that upsell revenue is tagged to support interactions in the CRM, not estimated.
- Validate that technology costs include depreciation and implementation, not just subscription fees.
- Confirm FCR is measured at the customer level (did the issue actually resolve?) not the ticket level (was the ticket closed?).
Pro Tip: Run this audit quarterly. ROI models drift as team structures, tools, and customer bases change. A model built on last year’s cost structure can be significantly wrong by Q3.
Practical Actions That Improve Customer Support ROI
Ranked by expected financial impact, these are the moves that consistently move the ROI number.
- Improve allocation to strategic accounts. Route your highest-value customers to your most experienced agents. The revenue protection from keeping a $50,000 ARR account from churning dwarfs any efficiency gain from faster ticket closure on low-value contacts.
- Deploy automation for low-complexity, high-volume contacts. Password resets, order status inquiries, and FAQ-type questions are the right targets. Automating these frees agent capacity for complex, high-value interactions without degrading CX.
- Invest in FCR through training and QA. Each percentage point of FCR improvement eliminates repeat contacts and reduces cost per resolution. A structured QA program that coaches agents on the specific failure modes driving repeat contacts typically shows payback within 60–90 days.
- Build feedback loops with product and marketing. Repeat contacts about the same product issue are a cost that product fixes eliminate entirely. Quantify the contact volume and cost of each recurring issue category, then present it to product as a prioritization input.
- A/B test automation flows before full rollout. Run new automation on 20% of a contact category, measure deflection and CSAT, then scale. This produces the pilot data your business case needs and avoids the risk of deploying a poorly calibrated bot at full volume.
Quick wins (payback under 90 days): automation for top-3 contact types, FCR coaching on top-3 failure modes, allocation routing rules for top-tier accounts.
Medium-term investments (payback 3–9 months): knowledge base buildout, QA program implementation, CRM tagging for upsell attribution.
Long-term investments (payback 9+ months): full AI deployment, proactive outreach programs, support-driven expansion playbooks.
A Value-Based Framework for Capturing ROI Beyond Operational Metrics
Operational KPIs measure what happened. The Value Enhancement Score (VES) measures what a support interaction did to a customer’s future revenue potential.
VES scores each support interaction across three dimensions:
- Confidence lift: Did the interaction increase the customer’s confidence in the product or service? (Measured via post-interaction survey, 1–5 scale)
- Advocacy intent: Did the customer indicate willingness to recommend or refer? (NPS-style question at interaction close)
- Expansion propensity: Did the interaction surface an unmet need or upgrade opportunity? (Agent-tagged in CRM)
A simple scoring example: a customer contacts support about a billing question. The agent resolves it in one contact, explains a feature the customer did not know existed, and the customer rates the interaction 5/5. Confidence lift: +2 points. Advocacy intent: positive. Expansion propensity: tagged as “upgrade opportunity.” That interaction scores high on VES and is flagged for a follow-up by the account team.
Map VES scores to CLV changes over a 6-month cohort. High-VES interactions should correlate with lower churn and higher expansion revenue in that cohort. If they do not, recalibrate the scoring weights.
VES works best for complex B2B SaaS and high-ARPU accounts where individual interactions carry significant revenue implications. For high-volume, transactional support, the operational ROI formula is sufficient.
Pro Tip: Pilot VES on 50–100 interactions before weighting the score. The first pass will reveal which dimension (confidence, advocacy, or expansion) is most predictive for your customer base. Weight that dimension more heavily in the final model.
Forbes’ analysis on customer service as a value center makes the same argument: moving beyond operational KPIs to a value-based framework is what separates support teams that justify their budgets from those that consistently fight for resources.
How Indirect Benefits Fit Into Your ROI Calculation
Brand loyalty and customer advocacy are real financial assets, but they are notoriously hard to put a number on. The practical approach is to include them as secondary evidence in your business case rather than primary inputs to the ROI formula.
Advocacy has a measurable proxy: referral revenue. If your CRM tracks deal source, you can calculate the revenue generated by customer referrals and attribute a portion to support quality. A customer who refers two new accounts worth $10,000 each has generated $20,000 in revenue. If that referral was triggered by a standout support experience, support gets partial credit.
Brand loyalty shows up in renewal rates and expansion revenue over time. Customers who consistently rate support interactions highly tend to renew at higher rates and expand their contracts more frequently. Track renewal rates by CSAT cohort and you will find a correlation that can be monetized in your model.
The honest caveat: attribution is imperfect. Support is one of many factors that influence loyalty and advocacy. Present these as supporting evidence alongside your primary ROI calculation, not as standalone proof. Finance teams will accept “support contributed to X% of referral revenue” more readily than “support generated $Y in brand equity.”
In-House vs. Outsourced Support: How Staffing Models Affect ROI
The staffing model you choose has a direct and lasting effect on your ROI calculation, primarily through its impact on cost per contact, quality consistency, and retention outcomes.
In-house teams carry higher fixed costs: salaries, benefits, training, management overhead, and office space. But they also deliver higher product knowledge, better quality consistency, and stronger alignment with retention and upsell goals. For companies where support interactions directly influence renewal and expansion decisions, in-house teams typically produce better retention ROI even when their per-contact cost is higher.
Outsourced models reduce variable cost per contact, often significantly, and scale faster during volume spikes. The trade-off is lower product knowledge, higher turnover among agents, and weaker attribution of support interactions to revenue outcomes. Outsourced agents are rarely tagged in CRM for upsell opportunities, which means the revenue side of your ROI model goes unmeasured.
A hybrid model, where routine contacts are outsourced and strategic or complex interactions are handled in-house, often produces the best ROI for mid-market companies. The key is defining the routing rules clearly: which contact types go where, and how escalation paths are structured to protect high-value accounts.
When modeling staffing ROI, include transition costs. Switching from in-house to outsourced (or vice versa) involves training, quality ramp-up time, and temporary CSAT degradation. A model that ignores these transition costs will overstate the ROI of the switch.
How Technology Costs and Depreciation Affect Your ROI Model
Technology is often the largest single line item in a support investment, and it is frequently undercosted in ROI models.
A helpdesk platform with a $500/month subscription looks cheap until you add implementation time (often 40–80 hours of internal labor at $50–$100/hour), training costs, integration development, and the productivity dip during the first 60–90 days of adoption. A $6,000 annual subscription can carry $15,000–$25,000 in total first-year costs when fully loaded.
Depreciation matters for capital expenditures like on-premise infrastructure or custom-built tools. A $120,000 custom integration amortized over three years adds $40,000 to annual support costs, which changes your ROI calculation materially.
For SaaS tools, the relevant cost concept is not depreciation but total cost of ownership (TCO): subscription fees plus implementation, training, integration maintenance, and the internal time spent managing the vendor relationship. Build TCO into your cost column, not just the subscription line.
The flip side: technology costs decline as a percentage of total support spend as volume scales. A $500/month tool handling 1,000 contacts costs $0.50 per contact in software. At 10,000 contacts, that drops to $0.05. Model your technology cost per contact at your projected volume, not your current volume, to get an accurate forward-looking ROI.
Case Studies: Before-and-After ROI Improvements in Support
Real-world ROI improvements tend to cluster around three types of initiatives: automation deployment, FCR improvement programs, and allocation restructuring.
At a fully loaded cost of $8 per agent-handled contact, that produced approximately $4,720 in monthly savings, or $56,640 annually, against a tool cost of $18,000 per year.
On a base of 3,500 monthly tickets, that eliminated roughly 315 repeat contacts per month. At $9 per contact, monthly savings reached $2,835, or $34,020 annually. The QA program cost $12,000 to implement (external consultant plus internal time). Payback period: approximately 4.2 months.
After restructuring routing rules to match agent tier to account tier, enterprise churn dropped by 0.8 percentage points over two quarters. On a base of 150 enterprise accounts at $80,000 average ARR, that retention improvement preserved approximately $960,000 in annual recurring revenue. The restructuring cost was primarily internal: about 60 hours of management time to redesign routing rules and retrain the team.
These examples share a common structure: a defined baseline, a specific intervention, a measurable outcome, and a clear cost. That structure is what makes an ROI story credible to finance.
The Part of ROI Models That Always Surprises Leadership
Most support leaders walk into their first ROI presentation expecting finance to push back on the cost estimates. What actually happens is that finance pushes back on the gains side, specifically on retention attribution.
The question is always some version of: “How do you know customers stayed because of support, and not because of the product update we shipped in Q2?” It is a fair question, and the answer requires cohort analysis, not aggregate statistics.
What I have seen work consistently: present three numbers, not one. Then show the breakeven point for each. Finance teams are trained to stress-test projections, and giving them a range to work with is more credible than a single ROI percentage.
The other thing that surprises leadership is how quickly automation pilots pay back. That is a fast payback relative to most technology investments. But the gains compound only if the knowledge base is maintained. Build knowledge base maintenance into the cost model from the start.
One more rule of thumb worth keeping: retention gains compound in a way that cost savings do not. Show finance a three-year NPV alongside the first-year ROI, and the support investment case gets considerably stronger.
Deskhero Gives Your Support Team a Measurable ROI Starting Point
The hardest part of building a support ROI model is not the math. It is getting clean data fast enough to run a credible pilot. Deskhero’s AI-powered helpdesk for sales-driven support is built to close that gap for small and mid-sized teams.
Every ROI lever covered in this guide maps directly to a Deskhero capability. The AI chat-bot deflects routine contacts by answering only from knowledge you have approved, so deflection rates are real and auditable. Two-way email sync and ticket routing reduce AHT without sacrificing quality. The Shopify integration surfaces customer order data inside tickets, giving agents the context they need to convert support interactions into upsell opportunities. Ticket analytics and the insights map give you the baseline data your ROI model needs from day one.
For a 30-day pilot, the setup is minimal: connect your existing Gmail or Microsoft 365 mailbox, no migration required. Track cost per contact, FCR, and upsell rate before and after. That is enough data to build a credible three-scenario business case for your next budget cycle. Start a no-credit-card 30-day trial and have your baseline numbers within the first two weeks.
Sources
- Best Ways to Measure the ROI of Customer Service | Balto
- Why Customer Service is Important: Data-Backed Facts to Know in 2026
- Gartner survey finds ninety-one percent of customer service leaders under pressure to implement AI in 2026
- Support Is Productive but Inefficient - ServiceXRG
FAQ
What is ROI in customer service?
Customer service ROI measures the financial return generated by support operations relative to their cost, calculated as (Financial gains − Support costs) ÷ Support costs × 100. Financial gains include cost savings, retention-driven revenue, and upsell revenue attributed to support interactions.
Is a 30% ROI good for customer support?
Once those are included, well-run support operations typically show higher returns.
What does “ROI customer” mean in a business context?
“ROI customer” typically refers to measuring the financial return generated by investing in customer relationships, including support, retention programs, and service quality improvements. It frames customers as assets whose value compounds over time rather than costs to manage.
Is a 24% ROI good for a support investment?
How do you improve customer support ROI quickly?
The fastest improvements come from automating the top three high-volume, low-complexity contact types and improving FCR through targeted QA coaching. Both typically show measurable cost reductions within 60–90 days, which is fast enough to validate in a single quarter’s data.