The Essential Helpdesk Reporting Metrics for Support Managers

The most useful helpdesk reports connect demand, speed, quality, and reliability. Start with ticket volume, first response time, resolution time, first contact resolution, SLA attainment, backlog age, reopen rate, escalation rate, workload by User, channel mix, and cost per ticket. Add customer satisfaction metrics only when you have a reliable survey process and enough responses to interpret them responsibly.
A practical reporting cadence looks like this:
- Ticket volume: daily snapshot and weekly trend
- First response time: daily trend, plus live SLA monitoring where applicable
- Resolution time: daily trend and weekly review
- First contact resolution: weekly
- SLA attainment: daily operational view and weekly summary
- Backlog age: daily
- Reopen and escalation rates: weekly
- Workload by User: daily for queue balancing
- Channel mix: weekly
- Cost per ticket: monthly
Do not start by tracking everything. Choose a small scorecard, confirm that the underlying timestamps and fields are trustworthy, and add detail only when it helps someone make a decision.
Key Takeaways
Reliable helpdesk reporting starts with clean event data, clearly defined formulas, and a review process that ends with an owner and an action.
| Point | Details |
|---|---|
| Separate metrics from KPIs | A metric describes activity. A KPI is a metric with a target, an accountable owner, and a decision attached to it. |
| Use distributions, not averages alone | Pair averages with medians, percentiles, or time buckets so a small number of slow tickets cannot hide the typical experience. |
| Benchmarks need context | Use your own baseline, channel mix, ticket complexity, staffing, and service commitments before setting targets. |
| Data quality comes first | Define which events start, pause, and finish each clock before publishing a score. |
| Deskhero includes fixed reporting views | Deskhero provides an operational Dashboard and a Statistics area with nine fixed tabs, filters, chart and table views, and Excel export on most tabs. |
Table of Contents
- What is the difference between a helpdesk metric and a KPI?
- The core helpdesk reporting metrics, grouped by purpose
- How to set realistic targets and benchmarks for your team
- How to design dashboards that each audience will actually use
- Getting your data right before you report it
- Reporting pitfalls that make your metrics misleading
- A practitioner-ready dashboard template you can copy today
- Where reporting actually pays off
- Deskhero gives you reporting-ready data from day one
- Sources
- FAQ
What is the difference between a helpdesk metric and a KPI?
A metric is any measured value, such as tickets created, median first response time, or the number of open tickets. A KPI is a metric selected to represent an important outcome. It has a definition, a target or acceptable range, an owner, and a response when performance moves outside that range.
Ticket volume is usually a diagnostic metric. It describes demand, but it does not say whether the team performed well. First response SLA attainment can be a KPI because it measures performance against a stated commitment. Even then, it should be read with quality and workload data.
A useful split is:
- Diagnostic metrics: ticket volume, channel mix, priority mix, category mix, and backlog composition
- Possible KPIs: first response time, resolution time, SLA attainment, first contact resolution, reopen rate, and customer satisfaction
Classification depends on what the organization is trying to improve. A cost metric might be central to one support operation and irrelevant to another. Write the intended decision next to every KPI. If nobody can explain what action a change should trigger, the metric probably belongs in a diagnostic view instead.
Pro Tip: Document every KPI in one sentence: formula, population, time window, exclusions, owner, and target. This prevents two teams from using the same label for different calculations.
The core helpdesk reporting metrics, grouped by purpose
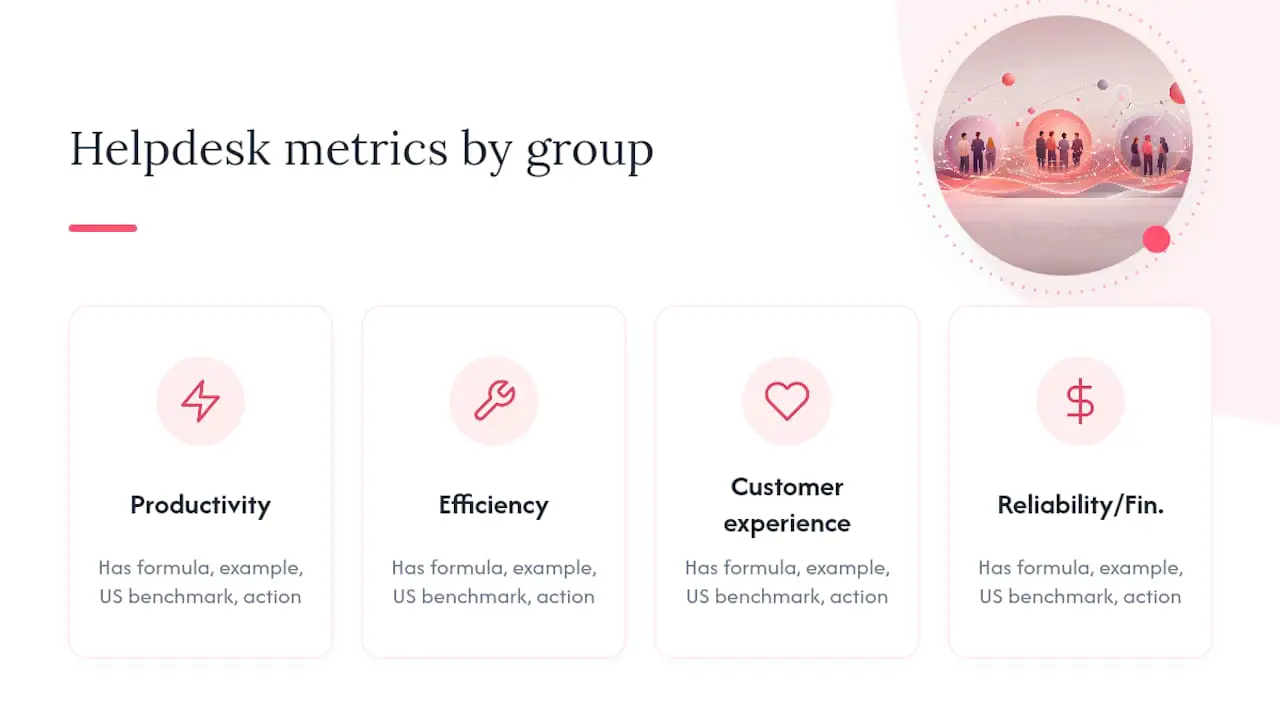
Group metrics by the question they answer. Demand metrics describe what entered the queue. Efficiency metrics show how work moved. Experience metrics reflect customer feedback. Reliability metrics show whether commitments were met. Financial metrics connect support activity to cost.
Productivity metrics
Ticket volume
Definition: Tickets created during a reporting period.
Formula: Count tickets by creation timestamp within the selected period.
Use: Compare volume by day, channel, group, priority, and category. Investigate spikes before changing staffing.
Resolved volume
Definition: Tickets resolved during the period.
Use: Compare created and resolved volume over the same interval. If created volume repeatedly exceeds resolved volume, backlog is likely to grow.
Workload by User
Definition: Tickets assigned, touched, or resolved by each User, depending on the question.
Use: Balance queues and identify concentration of work. Do not turn one workload count into a performance ranking without accounting for complexity, availability, and quality.
Channel breakdown
Definition: The share of tickets created through each channel.
Formula: Tickets from a channel divided by all tickets in the period.
Use: Align staffing and service targets with actual demand.
Efficiency metrics
First response time
Definition: Time from ticket creation to the first qualifying human or automated reply, according to your reporting policy.
Use: Report the median, the 90th percentile, and time buckets. State whether the clock uses calendar time or business hours and whether automatic acknowledgements count.

Resolution time
Definition: Time from ticket creation to resolution.
Use: Segment by group, priority, category, and escalation status. If the clock pauses while waiting for a customer, document that rule.
First contact resolution
Definition: The share of eligible tickets resolved during the first support interaction without a later follow-up or reopen within the chosen observation window.
Use: Define the observation window and eligible channels before comparing periods. A simple zero-reopen flag is not always enough to establish first contact resolution.
Replies to resolution
Definition: The number of replies exchanged before resolution.
Use: Look for categories that create avoidable back-and-forth. A low count is useful only when the issue was actually solved.
Customer experience metrics
Customer satisfaction
Definition: The share or average of responses to a defined post-interaction survey.
Use: Always report response count and response rate with the score. Review written comments and segment carefully, especially when sample sizes are small.
Net Promoter Score
Definition: Percentage of promoters minus percentage of detractors from a defined recommendation survey.
Use: Treat it as a broader relationship measure, not as a direct substitute for ticket-level satisfaction.
Reopen rate
Definition: Resolved tickets reopened within a defined period divided by eligible resolved tickets.
Use: Review categories, Users, and closure practices when the rate changes. A reopen can indicate incomplete resolution, but it can also reflect a customer adding a new issue to an old thread.
Reliability and SLA metrics
SLA attainment
Definition: Completed response or resolution clocks that met the applicable target divided by completed clocks in the reporting population.
Use: Keep attainment separate from the live count of tickets currently at risk or breached. The first is a historical verdict, while the second is an operational snapshot.
Backlog age
Definition: The age distribution of open tickets.
Use: Show age buckets and the oldest tickets. Choose thresholds that match your service commitments instead of applying one universal limit.
Escalation rate
Definition: Tickets escalated to another group or specialist divided by eligible tickets.
Use: Segment by category and priority. Escalation can signal a knowledge gap, but it can also be the correct path for complex work.
Financial metrics
Cost per ticket
Definition: Allocated support costs for a period divided by eligible tickets handled in that period.
Use: Document which salaries, software, contractors, and overhead are included. Compare like periods and similar ticket populations.
Cost by channel or category
Definition: Allocated cost for a channel or category divided by its eligible ticket volume.
Use: Use this only when time and cost allocation are good enough to support the calculation. False precision is worse than leaving the field blank.
How to set realistic targets and benchmarks for your team
Universal helpdesk benchmarks are rarely universal. A target depends on channel, business hours, ticket complexity, priority, staffing, and the promise made to customers. Set targets from your own operation first.
- Define the metric. Write down the start event, end event, pauses, exclusions, and eligible population.
- Build a baseline. Use enough history to cover normal variation. Compare median and percentile values, not just averages.
- Segment the baseline. Separate channels, priorities, groups, and major ticket categories when their workflows differ.
- Connect the target to a commitment. SLA targets should match the service promise. Internal improvement targets should be challenging but operationally plausible.
- Review the target after process changes. New routing, staffing, automation, or product releases can change the baseline.
| Metric | Target approach | Suggested cadence |
|---|---|---|
| First response time | Set by channel, priority, and service commitment | Daily |
| Resolution time | Set by priority and ticket category | Daily and weekly |
| First contact resolution | Baseline by category and define an observation window | Weekly |
| Customer satisfaction | Set only after response volume and bias are understood | Weekly or monthly |
| SLA attainment | Match the published or contracted commitment | Daily and weekly |
| Backlog age | Use thresholds tied to priority and service policy | Daily |
| Reopen rate | Baseline by category and closure policy | Weekly |
| Cost per ticket | Track a consistently defined internal trend | Monthly |
Use rolling windows when a metric has a small sample or strong daily variation. Use period comparisons when you need to identify operational changes. In both cases, show the number of eligible tickets so readers can judge how stable the result is.
How to design dashboards that each audience will actually use
A dashboard works when every card answers a question for its audience. Operational views should help people act now. Management views should explain trends and exceptions. Executive views should connect support outcomes to service, risk, and cost.
Audience-to-metric mapping
Users need their open work, waiting-first-reply tickets, due or breached SLA clocks, and enough queue context to choose the next ticket.

Team leads need created versus resolved volume, backlog age, response-time distribution, SLA risk, and workload by User. They also need drill-down links to the tickets behind a number.
Support managers need trends by group, priority, channel, and category, plus clear definitions for each KPI. A top-line scorecard should lead to a table or chart that explains the change.
Executives usually need a small set of service, quality, risk, and cost indicators. Show the target, current value, direction, and a short explanation of material changes.
Recommended widgets
- Created versus resolved tickets: trend lines using the same interval
- First response distribution: median, 90th percentile, and time buckets
- Resolution trend: segmented by priority or category
- SLA right now: current breached, due soon, and paused clocks
- SLA attainment: completed clocks that met their targets for the selected period
- Backlog by age: open-ticket counts in useful age buckets
- Workload table: per-group and per-User activity with relevant context
- Channel and topic breakdowns: demand mix and recurring themes
Report cadence
- Live operational view: open tickets, waiting first reply, and current SLA risk
- Daily review: volume, backlog age, first response, resolution time, and breaches
- Weekly review: trends, exceptions, reopen rate, escalation rate, and improvement actions
- Monthly review: service outcomes, cost, capacity, and target changes
Keep each meeting tied to decisions. A weekly review should end with a named owner, a due date, and the metric that will show whether the change worked.
Getting your data right before you report it
Metrics are only as reliable as their event definitions. Before building a dashboard, confirm that the ticket system records creation, reply, status, assignment, and resolution events consistently.
Minimum ticket schema
A reporting export often needs fields like these:
ticket_id: stable ticket identifiercreated_at: ticket creation timestampfirst_qualifying_response_at: timestamp used by the first response definitionresolved_at: resolution timestampassignee_id: current or event-time assignee, clearly labeledgroup_id: responsible groupchannel: source channelpriority: controlled priority valuestatus: controlled status valuetags: controlled categories where possiblesla_policy_id: applicable policy, when presentreopened_count: number of reopen events
Not every platform exposes the same schema. Treat these as reporting concepts, not as a claim about exact field names. If a value can change, decide whether the report needs the current value or the value at the time of the event.
Tagging and taxonomy
Use a controlled taxonomy for categories that drive staffing, routing, or improvement work. Keep the list small enough to use consistently. Audit uncategorized tickets and near-duplicate labels before trusting category trends.
Automation can help assign fields, but automated classification still needs review. Track unknown or low-confidence results instead of forcing every ticket into a misleading category.
Instrumentation checklist
- [ ] All timestamps use one stored time standard and a documented display timezone
- [ ] The first response definition states whether automated replies count
- [ ] Business-hour and calendar-hour clocks are not mixed
- [ ] Paused statuses are documented for resolution clocks
- [ ] Reopen and escalation events have explicit definitions
- [ ] Current assignee is not confused with assignee at resolution
- [ ] Deleted, merged, spam, test, and imported tickets have a stated inclusion policy
- [ ] Every score shows its eligible ticket count
Pro Tip: Recalculate a small sample by hand. If the dashboard result cannot be reproduced from ticket events, fix the definition or the data before setting a target.
Reporting pitfalls that make your metrics misleading
-
Treating ticket count as performance. Volume measures demand. Pair it with backlog, speed, and quality before drawing conclusions about performance.
-
Reporting an average without a distribution. Averages can hide long waits. Add a median, percentile, or time-bucket view.
-
Ranking Users by closed tickets alone. Ticket complexity, working hours, reassignment, and quality all affect counts. Use workload tables for balancing work, not as a standalone performance score.
-
Mixing unlike ticket populations. Different priorities, channels, and categories often need different targets. Segment before comparing.
-
Confusing live SLA state with historical attainment. A ticket that is currently breached is an operational problem. A completed clock that missed its target belongs in the attainment rate. Do not blend the two populations.
-
Ignoring denominator changes. A percentage can move because the eligible population changed. Always show the count behind it.
-
Inventing precision. If handle time, cost allocation, or survey coverage is incomplete, label the limitation or omit the metric.
A practitioner-ready dashboard template you can copy today
The template below is platform-neutral. Adjust the field names and formulas to match your data model, then document every adjustment.
Spreadsheet schema and formulas
| Column name | Formula or source | Notes |
|---|---|---|
ticket_id |
Ticket system | Stable key |
created_at |
Ticket event | Store in one time standard |
first_response_at |
First qualifying response event | Document automatic reply treatment |
resolved_at |
Resolution event | Document reopen handling |
frt_minutes |
Difference between creation and first response | Calendar or business minutes |
resolution_minutes |
Difference between creation and resolution | Subtract documented pauses if applicable |
reopened_count |
Count of reopen events | Choose an observation window |
sla_first_reply_met |
SLA clock verdict | Null if no applicable completed clock |
sla_resolution_met |
SLA clock verdict | Null if no applicable completed clock |
channel |
Ticket source | Controlled value |
priority |
Ticket field | Controlled value |
group_id |
Ticket field or event history | State whether current or event-time |
Sample SQL snippets
Calendar-time first response in MySQL:
SELECT ticket_id,
       TIMESTAMPDIFF(MINUTE, created_at, first_response_at) AS frt_minutes
FROM tickets
WHERE first_response_at IS NOT NULL;
Created tickets by current assignee and day:
SELECT assignee_id,
       DATE(created_at) AS ticket_date,
       COUNT(*) AS tickets_created
FROM tickets
GROUP BY assignee_id, DATE(created_at)
ORDER BY ticket_date DESC, tickets_created DESC;
Completed first response SLA attainment:
SELECT
  AVG(CASE WHEN sla_first_reply_met = 1 THEN 1.0 ELSE 0.0 END) * 100 AS attainment_pct
FROM tickets
WHERE sla_first_reply_met IS NOT NULL
  AND created_at >= :period_start
  AND created_at < :period_end;
These examples use simplified fields and calendar time. Production reporting must apply the same eligibility, business-hour, pause, merge, and deletion rules as the source system.
Dashboard tab layout
- Operational tab: open queue, waiting first reply, current SLA risk, and oldest tickets
- Management tab: created versus resolved trend, response distribution, resolution trend, SLA attainment, backlog age, and workload tables
- Executive tab: selected service, quality, risk, and cost KPIs with targets and short commentary
Pro Tip: Keep a metric dictionary beside the dashboard. Version changes to formulas and targets so historical shifts remain explainable.
Where reporting actually pays off
Reporting pays off when it changes queue management, staffing, routing, documentation, or product work. A sophisticated chart that produces no decision is less useful than a simple backlog view that helps the team clear old tickets.
Start with one demand measure, one speed measure, one reliability or quality measure, and backlog age. Review them together. If volume rises while response time remains stable, the team may have capacity. If resolved volume trails created volume and backlog ages, the problem is visible before a single headline average becomes alarming.
Use drill-downs to move from a pattern to the tickets behind it. The best review question is not simply, “Why did the number change?” It is, “Which tickets caused the change, what do they have in common, and what will we do differently?”
Deskhero gives you reporting-ready data from day one
Deskhero turns connected Gmail, Google Workspace, and Microsoft 365 mailboxes into shared ticket queues. It also accepts tickets from embedded forms and its FAQ-grounded AI chat-bot.

Deskhero includes an operational Dashboard with ticket status views, waiting-first-reply tickets, ticket-volume trends, average first reply time, average resolution time, and average time per status. Its Statistics area has nine fixed tabs covering overview, trends, response times, SLA, team, AI and automation, channels, topic statistics, and a topic cluster.
Statistics can be filtered by date and group, with an additional policy filter on the SLA tab. Chart cards can switch between chart and table views, and most tabs can be exported to Excel. Figures are scoped to the groups the signed-in User can access and are generally cached for about five minutes. The live SLA strip is separate from historical attainment.
Deskhero does not include a custom report builder. The topic views also have data gates: topic clustering needs roughly 100 tickets and is rebuilt periodically. A 30-day free trial is available without a credit card.
Sources
This guide uses the reporting behavior documented in Deskhero's product implementation. The related Deskhero guides below provide additional context on dashboards and ticket intake.
- Customer Support Dashboards for Support Managers: Templates & KPIs
- Email to Ticket: The Complete Guide for Support Teams
FAQ
What are the key metrics for service desk reporting?
Start with ticket volume, created versus resolved volume, first response time, resolution time, SLA attainment, backlog age, reopen rate, escalation rate, workload by User, and channel mix. Add satisfaction and cost metrics when their source data is reliable.
What are good KPIs for an IT help desk?
First response, resolution, SLA attainment, first contact resolution, reopen rate, and customer satisfaction can all be useful KPIs. Choose only the metrics tied to an important outcome, a clear target, and an action the team can take.
How often should you send CSAT surveys?
Choose a consistent trigger that matches the customer journey, such as after eligible ticket resolution. Keep the survey short, avoid repeated requests to the same customer, and report response count and response rate with the score.
What is a good first contact resolution rate?
There is no useful universal rate for every team. Define what counts as first contact, set an observation window for follow-ups or reopens, baseline the rate by category and channel, and improve it without encouraging premature closure.
How do you calculate cost per ticket?
Divide consistently allocated support costs for a period by the eligible tickets handled in that period. Document which labor, software, contractor, and overhead costs are included, then compare like periods and ticket populations.